Health
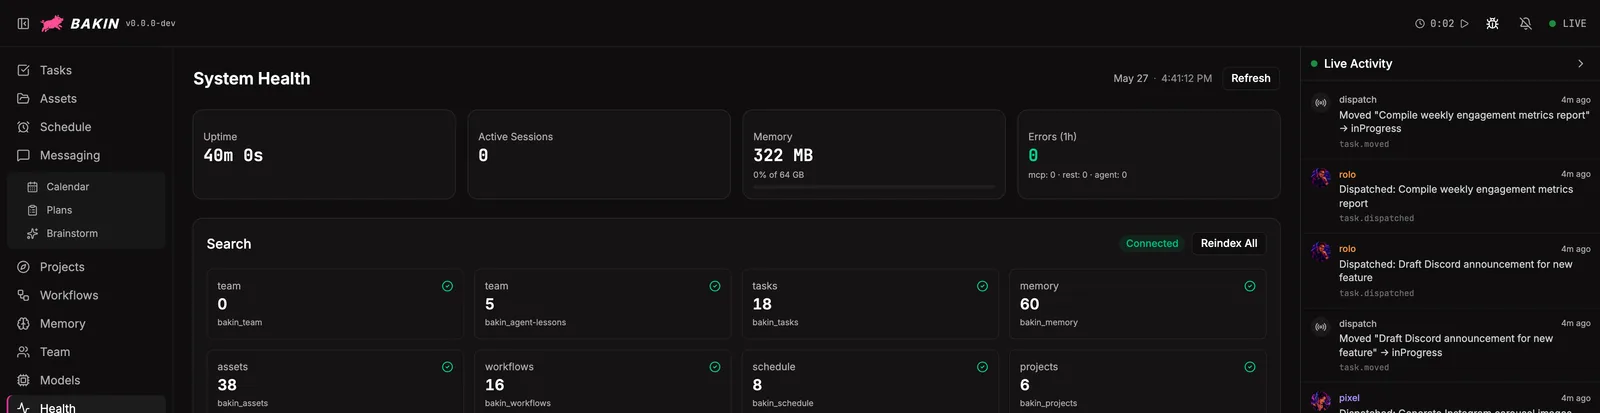
What’s each agent costing you? Which tool got hammered today? Whose context window is about to wrap? Whose dispatches are silently failing? Your runtime keeps the receipts but it doesn’t read them back to you. This dashboard does.
Live token counts, session costs, MCP and REST volumes, error rates, plugin status, search-engine state, the full diagnostic sweep. Without Bakin you’d be grepping JSONL transcripts to answer any of it.
Cost and Context
Section titled “Cost and Context”Two cards anchor the top of the dashboard side by side. They cover the questions that pile up fastest when you’ve got a roster running: what each agent is costing you, and whose context is about to overflow. Glance at them on the way past, look closer when something looks off.
| Card | What it answers |
|---|---|
| Context Usage | Total tokens in each agent’s latest session, bar-charted. Spot who’s pushing the model’s window before they hit it. |
| Runtime Cost Estimate | Input, output, cache-read, cache-write, and total per agent for each agent’s latest session. Bakin reports cost values only when the runtime includes them in session usage events; it does not maintain its own model pricing table. These values are directional, not invoice-grade. When the runtime omits cost, Health shows the cost as unavailable instead of treating it as $0.00. |
Call Volume
Section titled “Call Volume”Three tabs sit below the cost cards, all feeding from the same in-memory recorder. Same activity, sliced three ways. When something looks off in the system, this is usually the first place you’ll see it.
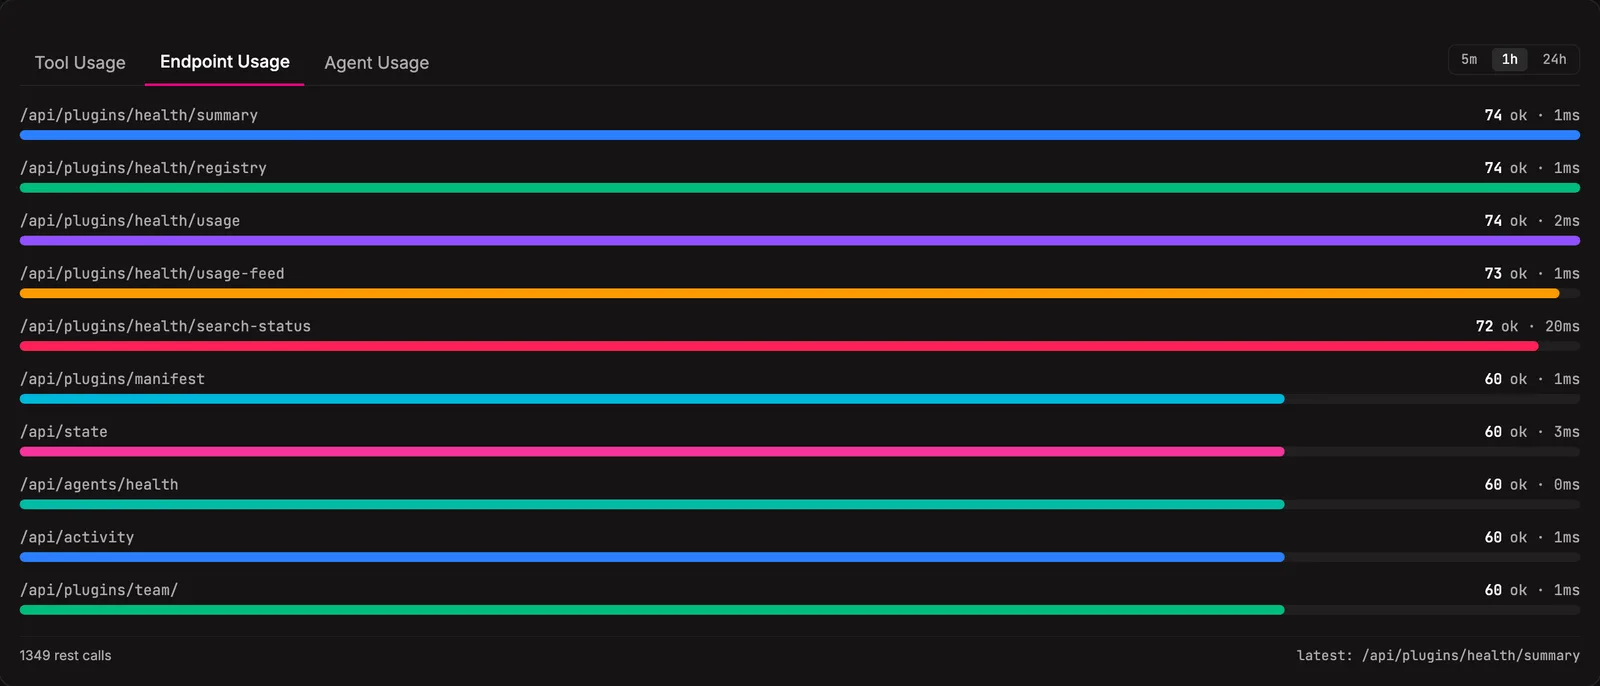
| Tab | What it counts |
|---|---|
| Tool Usage | Every MCP exec tool call, by name (e.g. bakin_exec_tasks_create). Count + error rate per window. |
| Endpoint Usage | Every REST endpoint hit, by path. Count + error rate. |
| Agent Usage | Calls + errors per agent. Quick read on who’s busy and who’s stuck. |
Doctor
Section titled “Doctor”A green-light scan of every moving part in the stack. Agent roster, runtime adapter, search adapter, taskboard, assets, channel approvals, restart-recovery candidates, the works. Red means broken, yellow means drifting. The scan itself is report-only; repairable rows feed the explicit bakin doctor --fix and bakin doctor --delegate repair workflows.
Run it before you start the day or any time something feels off. Results cache so the dashboard reads fast; the refresh button (or bakin doctor from the CLI) forces a fresh sweep.
System Status
Section titled “System Status”Live state of the Bakin process and what it’s connected to:
| Section | What’s there |
|---|---|
| Server stats | Port, PID, memory in use, uptime, node version. |
| MCP sessions | Agents currently connected, open session count per agent, when they connected. |
| Plugin registry | Every plugin loaded, with route count and source (built-in vs user-installed). |
| Search engine | Antfly status and row counts per bakin_* table. |
Quick sanity check for “did everything actually start up?”
Pluggable health checks
Section titled “Pluggable health checks”Any plugin can register a health check that surfaces here alongside the built-ins. It picks up the same color coding (red / yellow / green), and plugins can attach explicit repair handlers for operator-approved fixes. If a plugin owns external state worth watching (an API key, a queue, a cache, a daemon), wire a check.
Settings
Section titled “Settings”| Setting | Type | Default | What it does |
|---|---|---|---|
| Refresh interval (seconds) | number | 30 | How often to poll for updated metrics |
| Detailed metrics | boolean | true | Show per-plugin and per-tool breakdowns |
From the CLI
Section titled “From the CLI”| Command | Purpose |
|---|---|
bakin status | Show dispatch and server status. |
bakin doctor [--full] [--notify-agent] [--fix|--delegate] [--yes] | Run health checks, apply explicit safe fixes, or create a delegated repair task. |
Full surface in the CLI reference.
HTTP API surface for this plugin: see the API reference.
For agents
Section titled “For agents”Agents can self-check via MCP exec tools.
bakin_exec_health_doctor: Run system diagnostics (agent roster, skill sync, runtime, taskboard, assets, etc.). Returns detailed check results. Use fresh=true to force a full re-check instead of returning cached results.bakin_exec_health_status: Get a quick system health summary — uptime, memory, active MCP sessions, and doctor error/warning counts. Useful for checking system state before starting work.
Full schemas in the Exec tools reference.
Related
Section titled “Related”- Models: pick cheaper models for the agents that show up loudest in Cost
- Essentials → System Status: the always-on dot in the header is backed by these checks
- Daily Operation: start, stop, restart, update, the lifecycle commands that affect health